


IOTA 10 Core Portable Network Traffic Analysis and Monitoring Solution
◆4 / 8 / 16 TB SSD Storage Options
◆Dual 40/100G interfaces
◆Dual 100M/1G and 1/10G RJ-45 Interfaces
◆Dual 1G SFP+ SPAN Ports
◆Lightweight, Field-Ready Design-under 2.5 kg
◆Long-Term Network Activity Recording
◆Dedicated Web Management Interface
◆Per-Port Customizable PCAP Capture
-
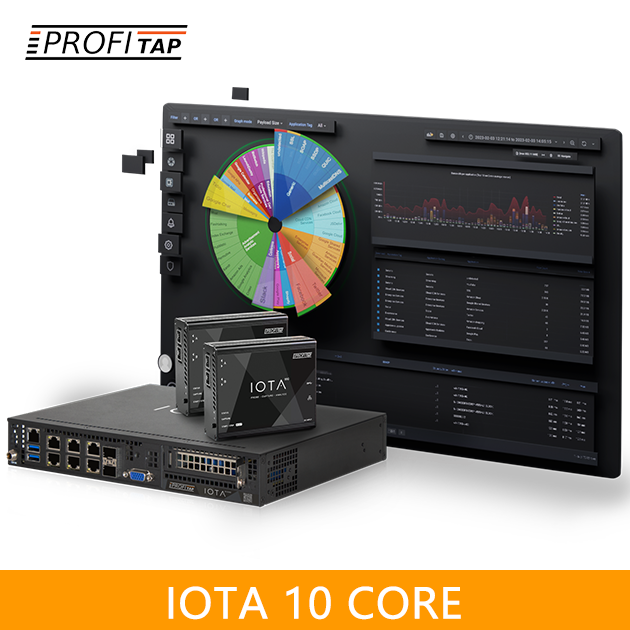
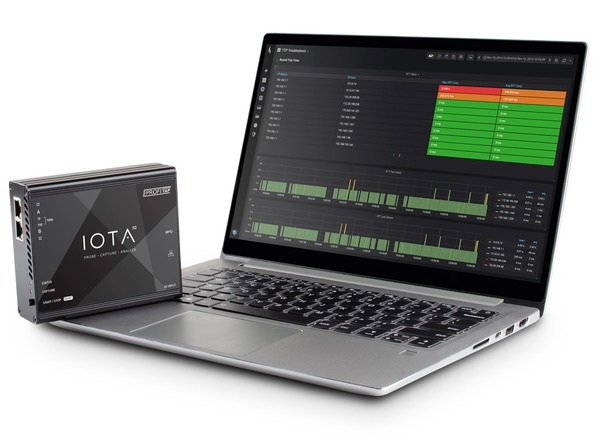
IOTA 10 CORE is a high-speed packet capture and analysis solution designed for core networks, large branch offices, and data centers. Beyond its powerful capabilities, its compact form factor and lightweight design make it an ideal, high-value tool for network engineers who require mobility. Combining high-performance capture, a metadata extraction engine, and integrated analytical dashboards, IOTA 10 CORE delivers complete visibility into critical network segments wherever it is deployed. Through real-time and historical traffic analysis of key application flows, IOTA enables engineers to quickly diagnose network bottlenecks and resolve application latency issues with precision and confidence.
Traffic access, capture, and analysis in a single box
IOTA CORE can be deployed independently at central or critical capture points, or integrated with TAPs and Network Packet Brokers (NPBs) to receive pre-aggregated and pre-filtered traffic from key points of interest across the network. With IOTA’s powerful integrated dashboards, network analysts can further refine, filter, and drill down into captured data for deeper visibility
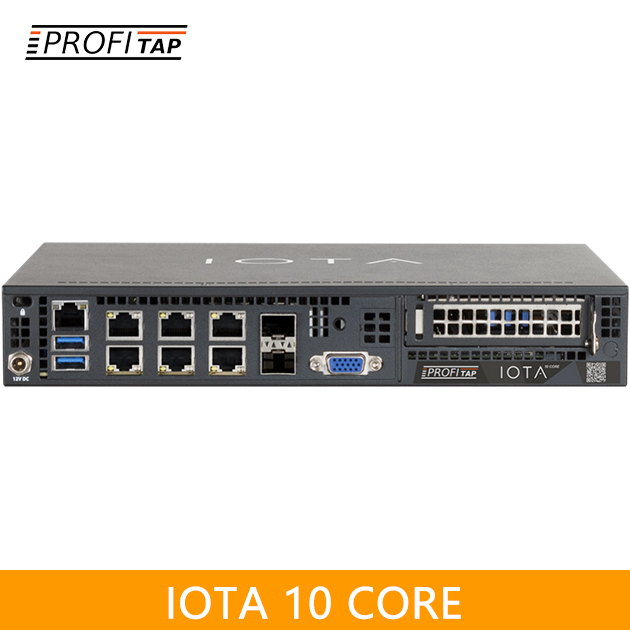
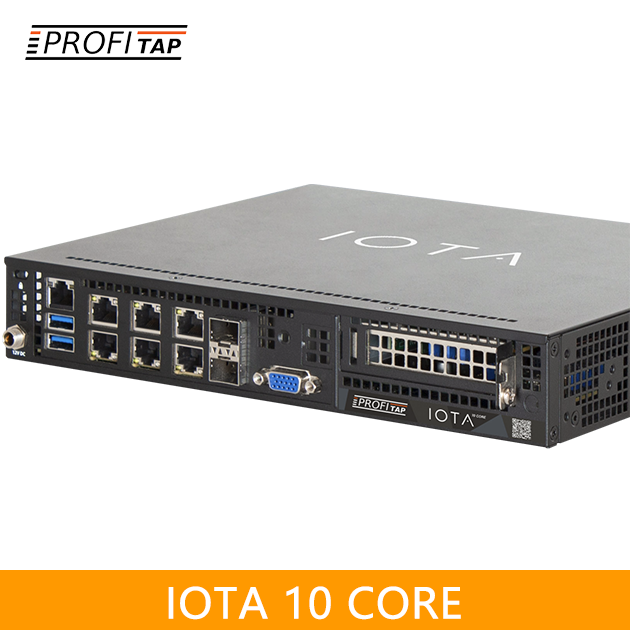
Features 6 packet capture input ports, providing exceptional flexibility for a wide range of capture and analysis scenarios. It supports 100M, 1G, and 10G speeds — 2 × 100M/1G RJ-45, 2 × 1/10G RJ-45, and 2 × 10G SFP+ interfaces. Ports can be logically grouped within capture sessions to correlate and analyze incoming traffic across multiple connections. With high-speed, high-capacity internal storage, the system enables both real-time and historical analysis of captured network data.

KEEP AN EYE ON
YOUR NETWORK
Monitor hosts, top talkers, latency, TCP, UDP, IPv4, IPv6, VLAN, DNS and many more at a glance, using a premade set of comprehensive dashboards.。
REMOTE
MONITORING
Fully managed over HTTPS and with built-in VPN, it offers easy deployment and usage in any network topology.
HIGHLY EFFICIENT METADATA COLLECTION
Up to 100 KPIs are extracted from packets, TCP/UDP flow and flow behavior. Flow metadata can reduce the volume of data by 90% compared to the original PCAP trace.
MONITOR NETWORK PERFORMANCE
Keep a close eye on the most essential performance metrics, retransmissions, packet loss, latency, throughput, availability, connectivity and more.
TRACK DOWN SECURITY FLAWS AND PROTOCOL/APPLICATION USAGE
Full visibility over 3000+ applications and protocols (DNS, HTTP, SSH, Office 365, Skype, Whatsapp, Netflix, etc.)
4, 8, or 16 TB STORAGE
PCAP collection, metadata database and system are stored on a high-performance SSD.
QUICK SEARCH DATABASE
Explore long-term dataset accumulated over days, weeks or months. -
IOTA is built for simplicity.
Anyone can deploy and operate it, while experts can perform remote analysis anytime, anywhere.
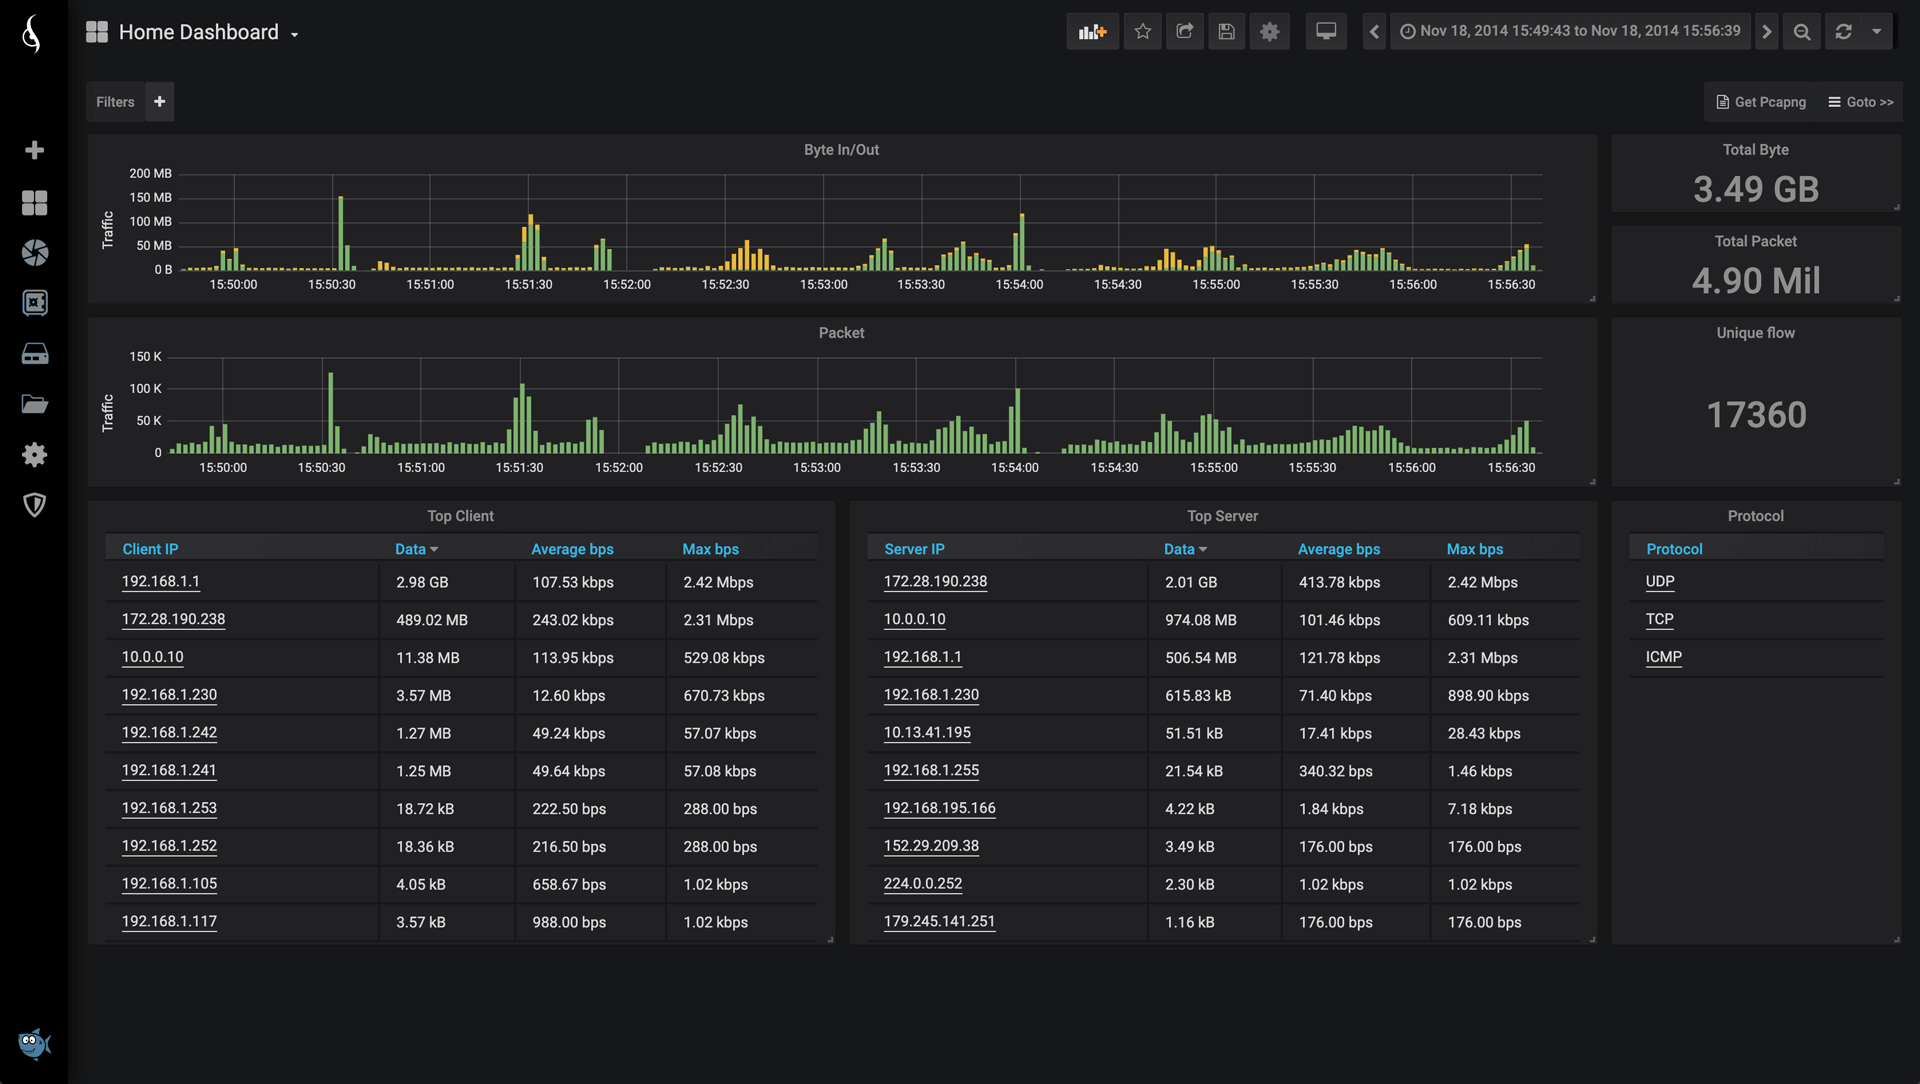
Home Dashboard(Click to enlarge)
A quick overview of Top Talkers and client-server data transfers.
TCP Round Trip Time(Click to enlarge)
RTT triggers per flow, server, and client.
TCP flag statistics.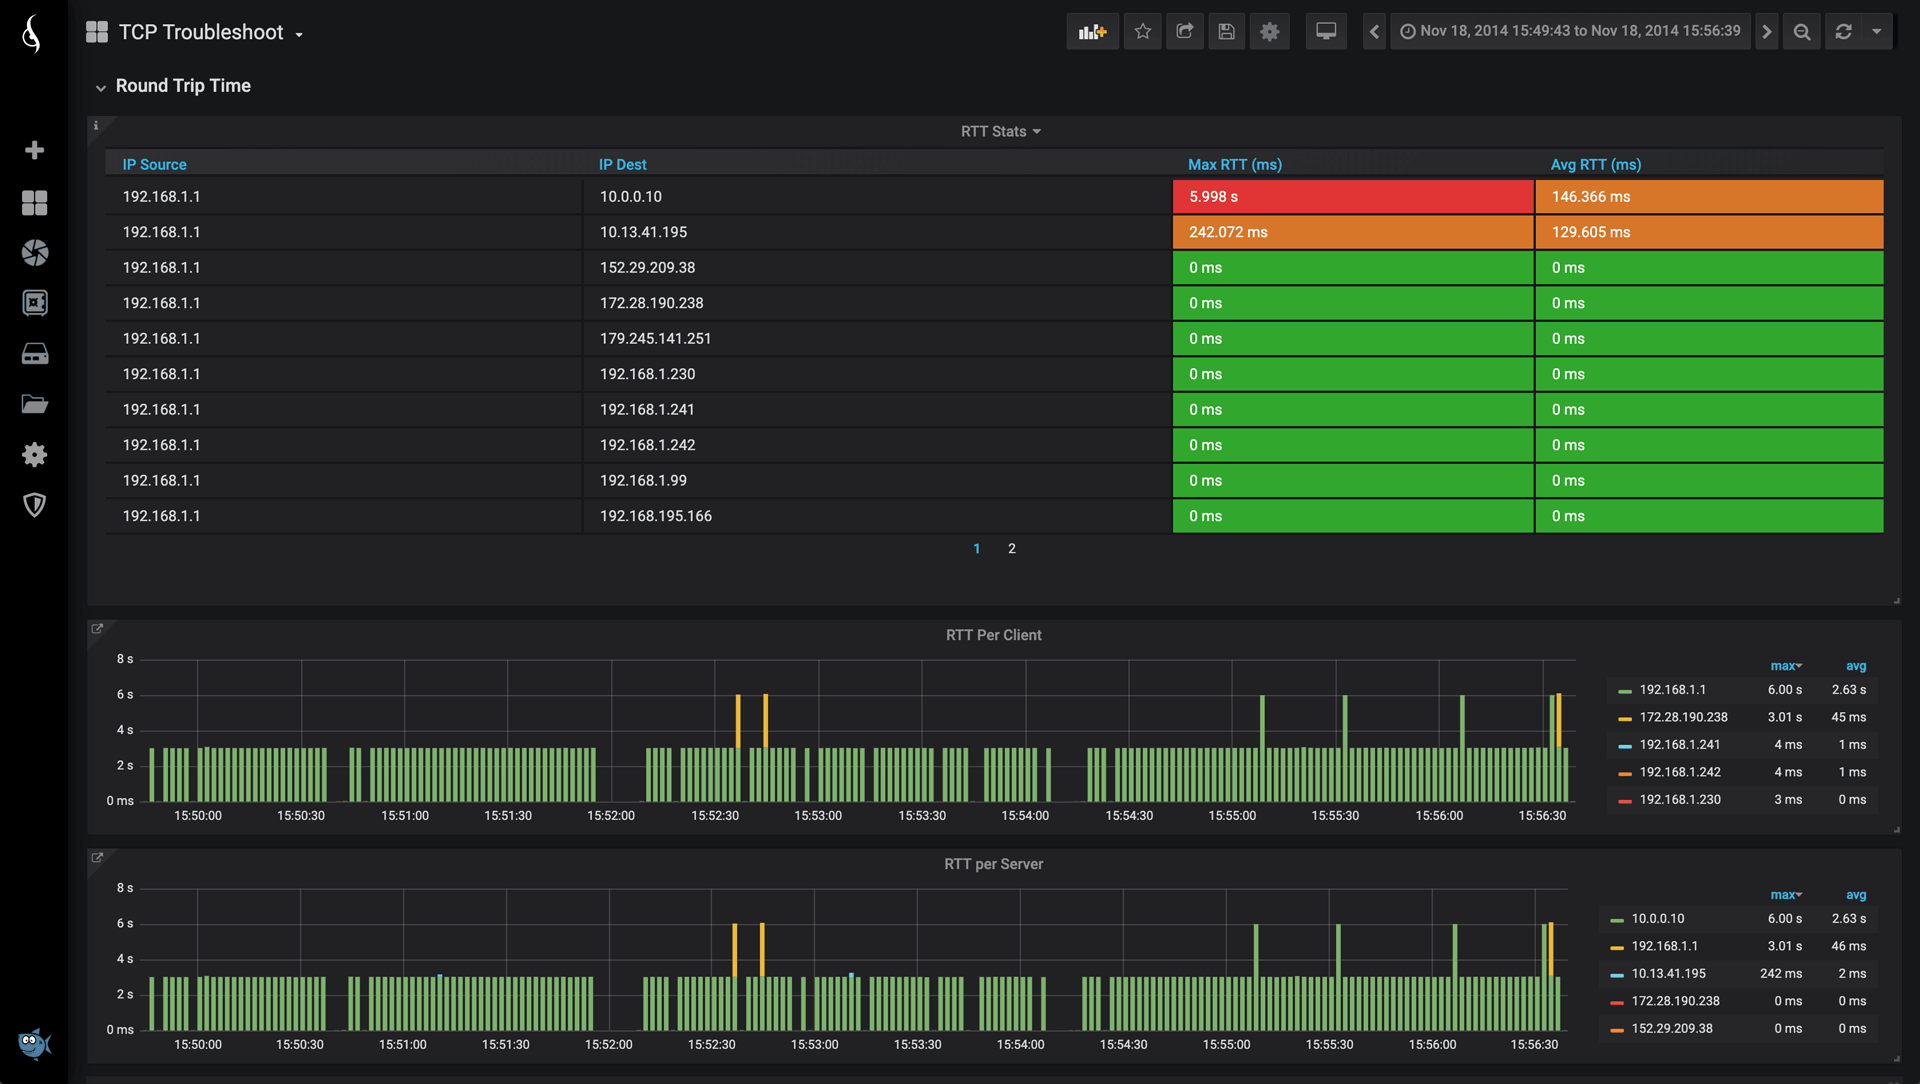
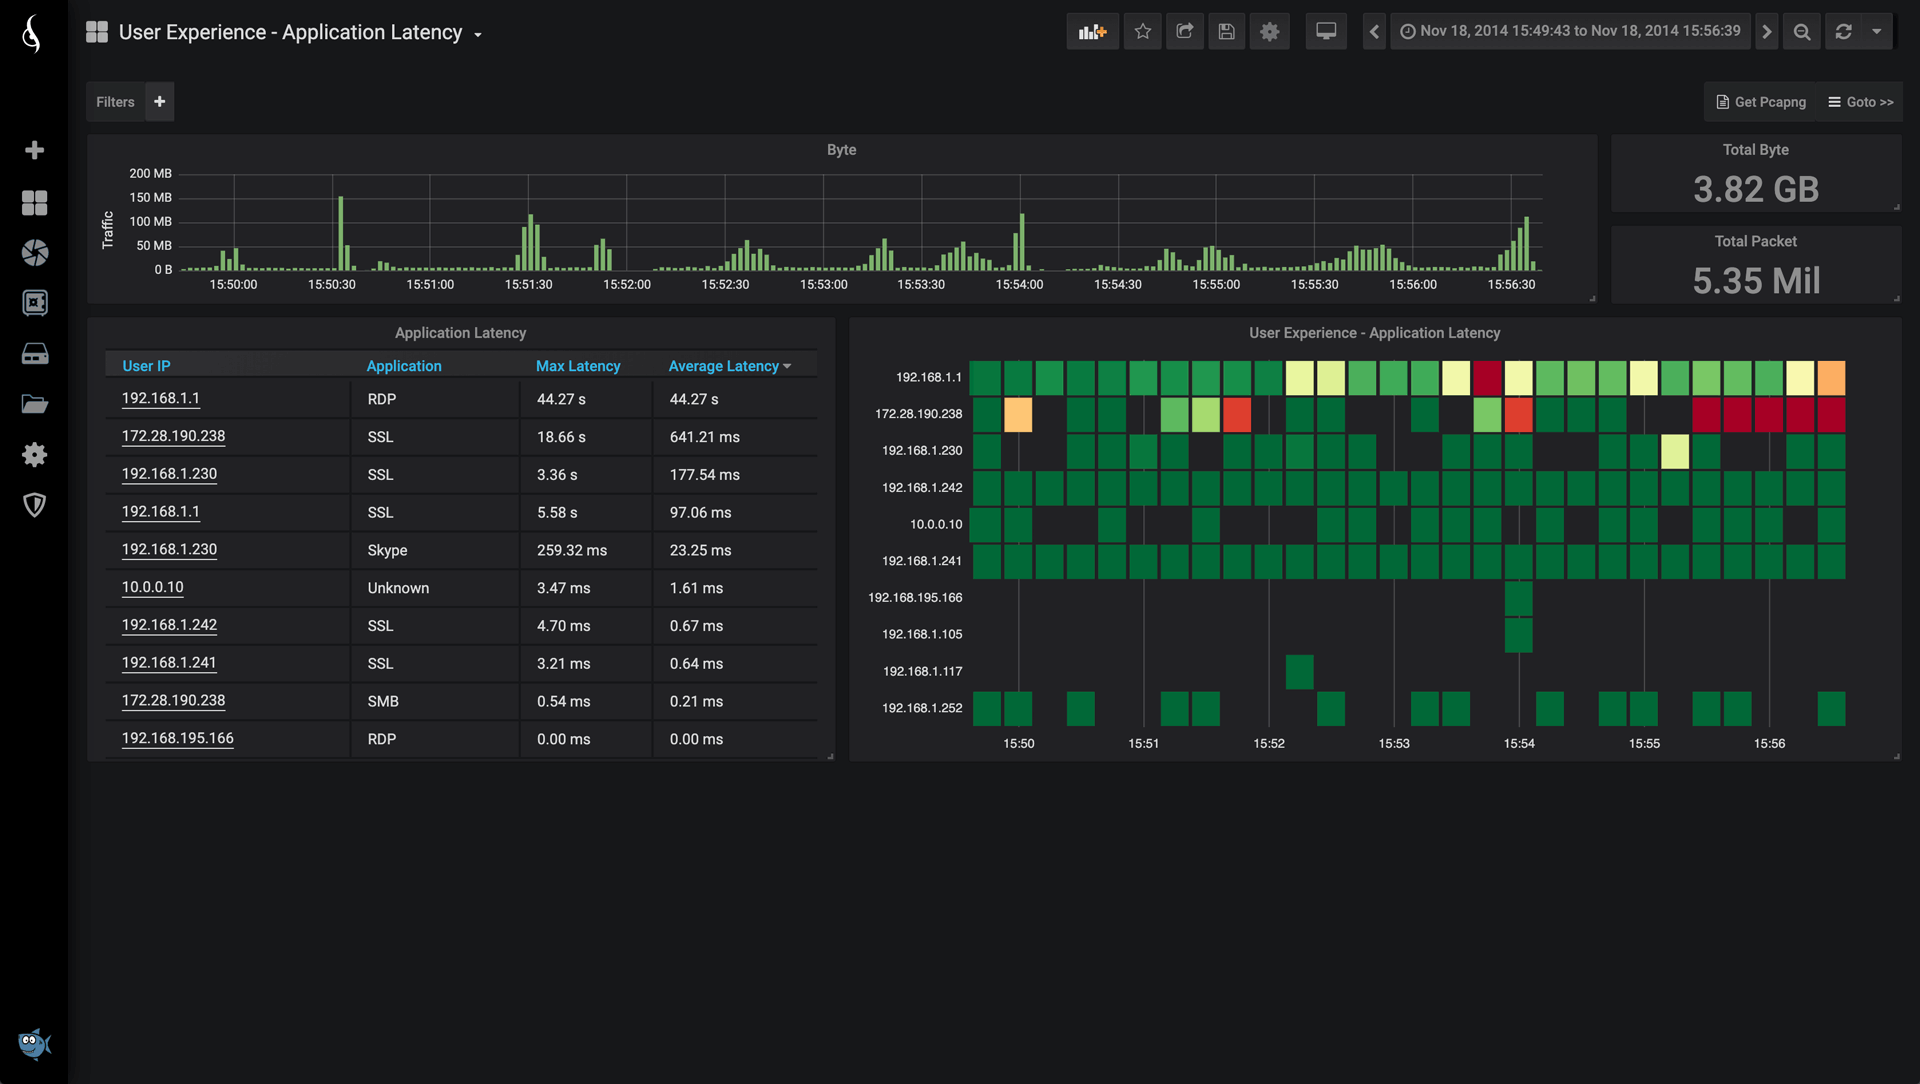
User Experience Application Latency(Click to enlarge)
Application latency from the client IP perspective.
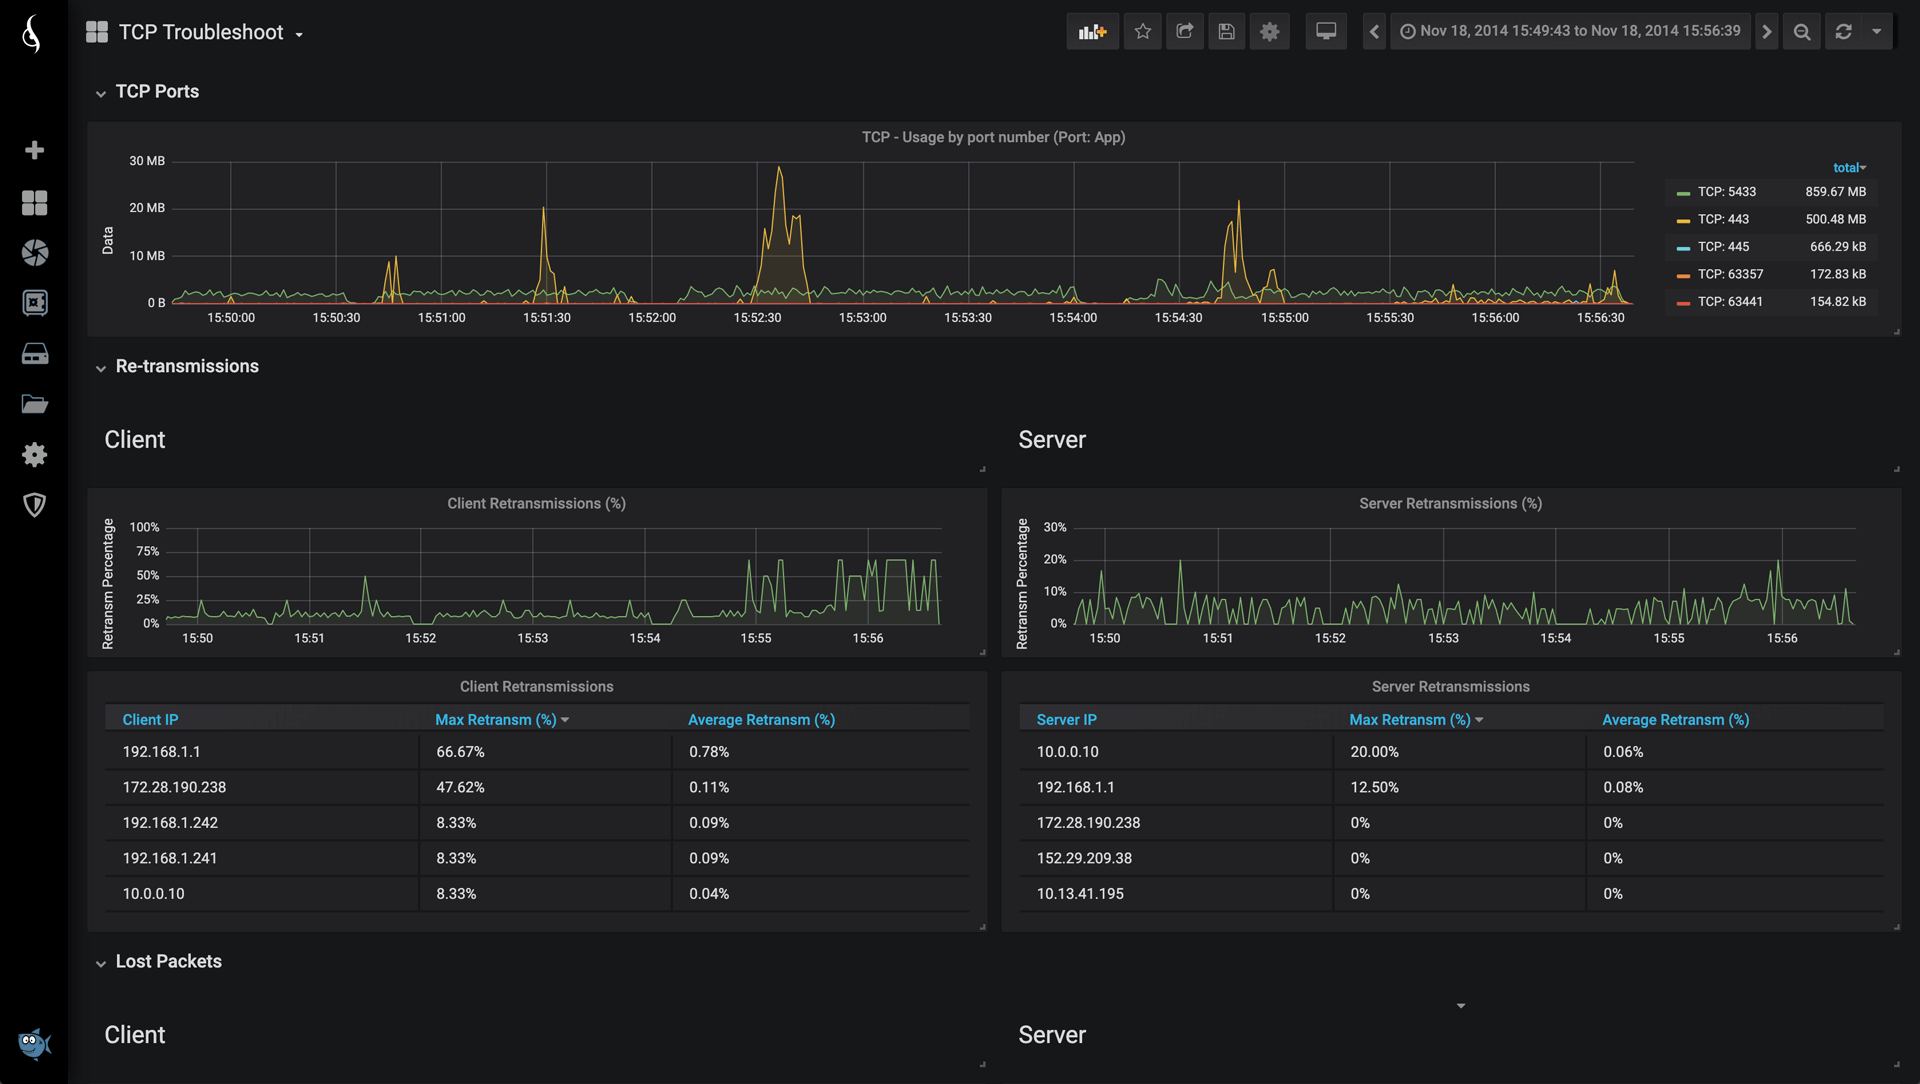
TCP Retransmissions(Click to enlarge)
Retransmissions percentage over time per client and server.
TCP flag statistics.
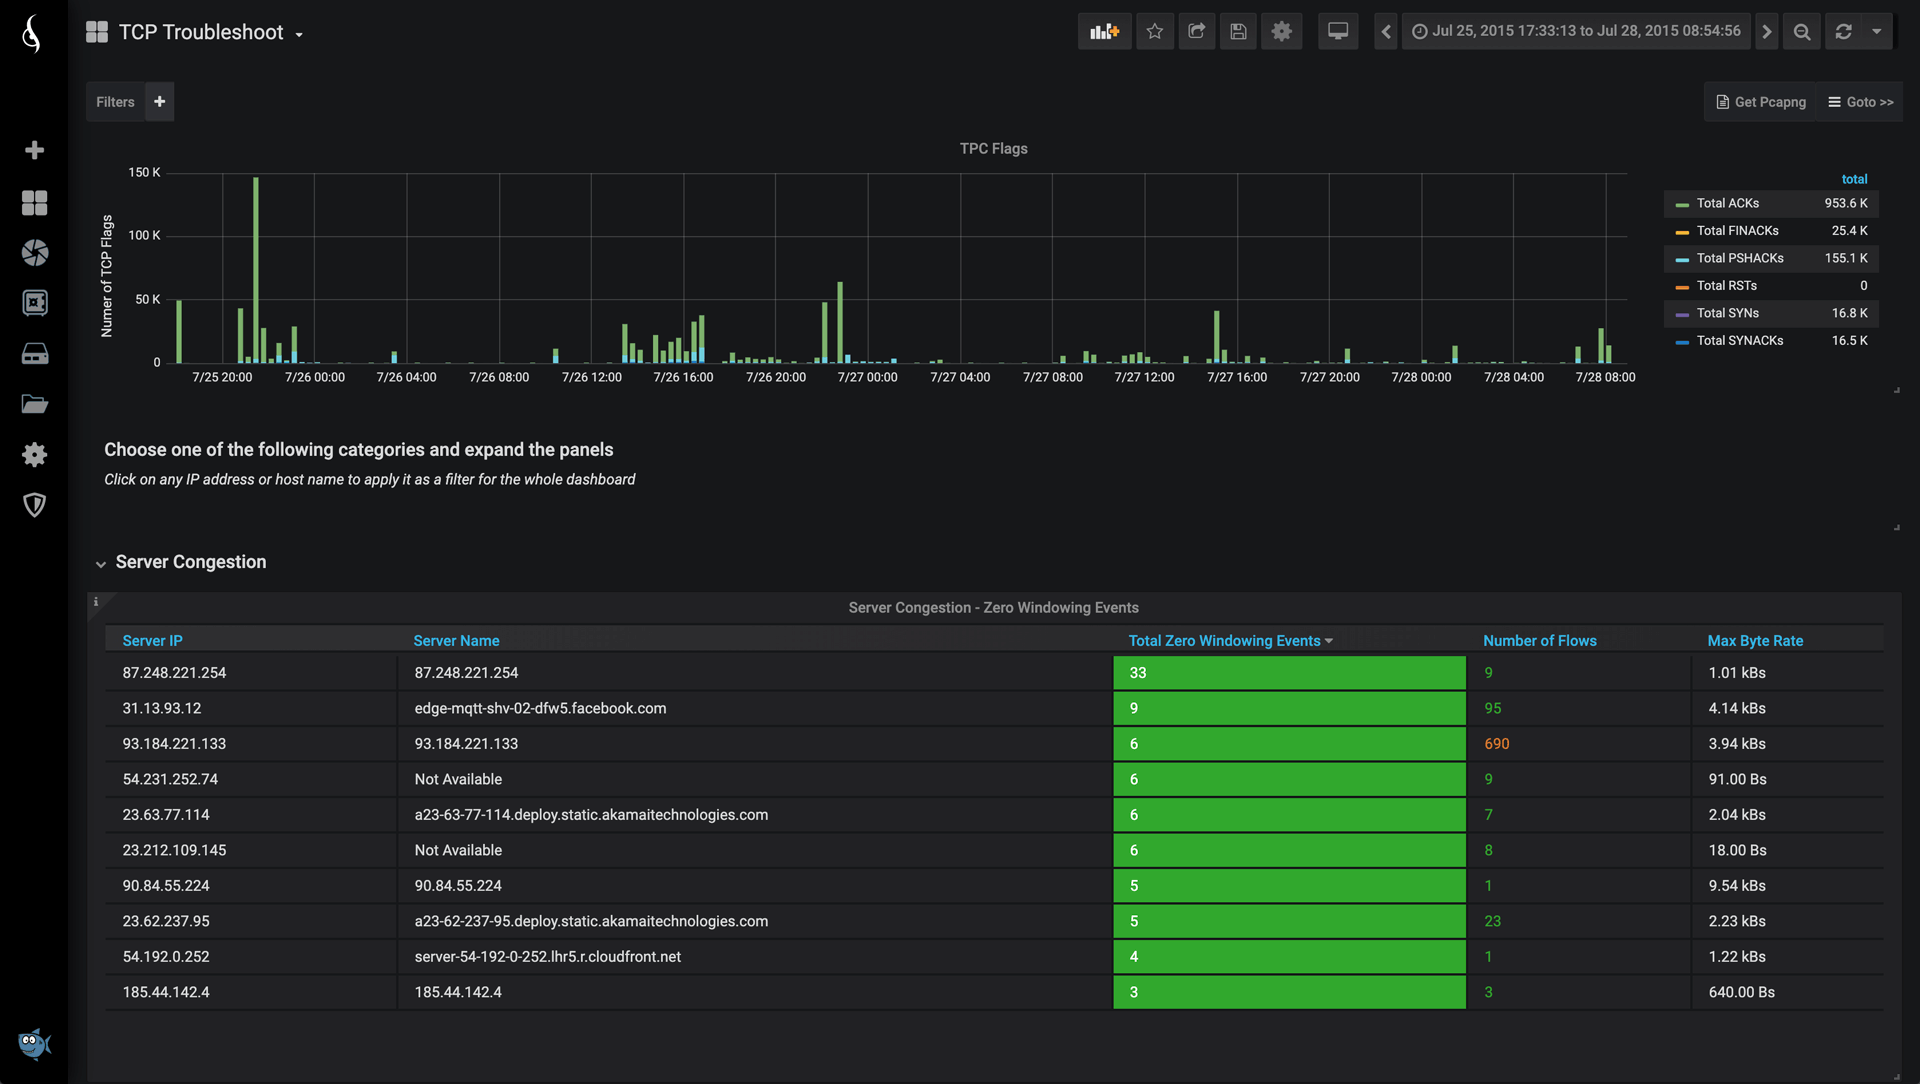
TCP Server Congestion(Click to enlarge)
An overview of zero windowing events per server over time, detecting when a
server is saturated. Includes statistics of number of flows per server.
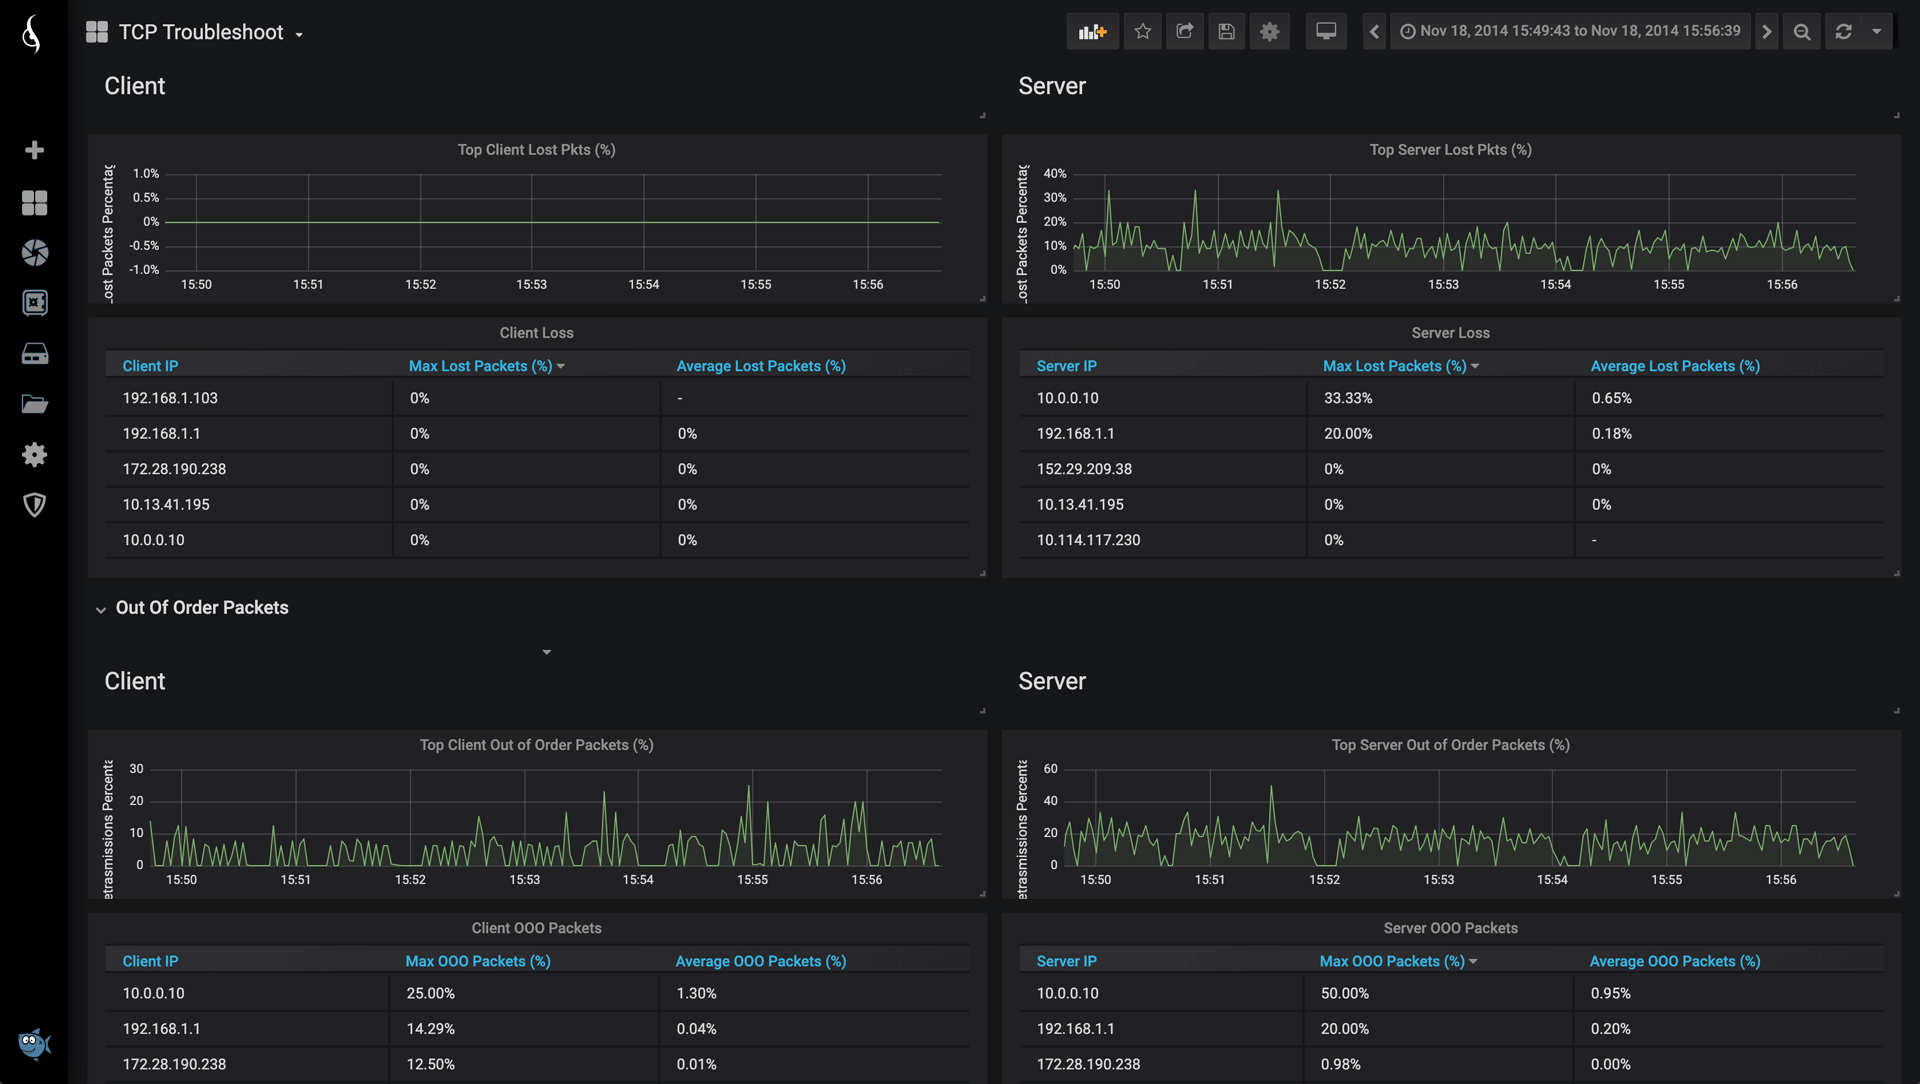
TCP OOO and Lost Packets(Click to enlarge)
Top Client / Server lost and Out Of Order packets.
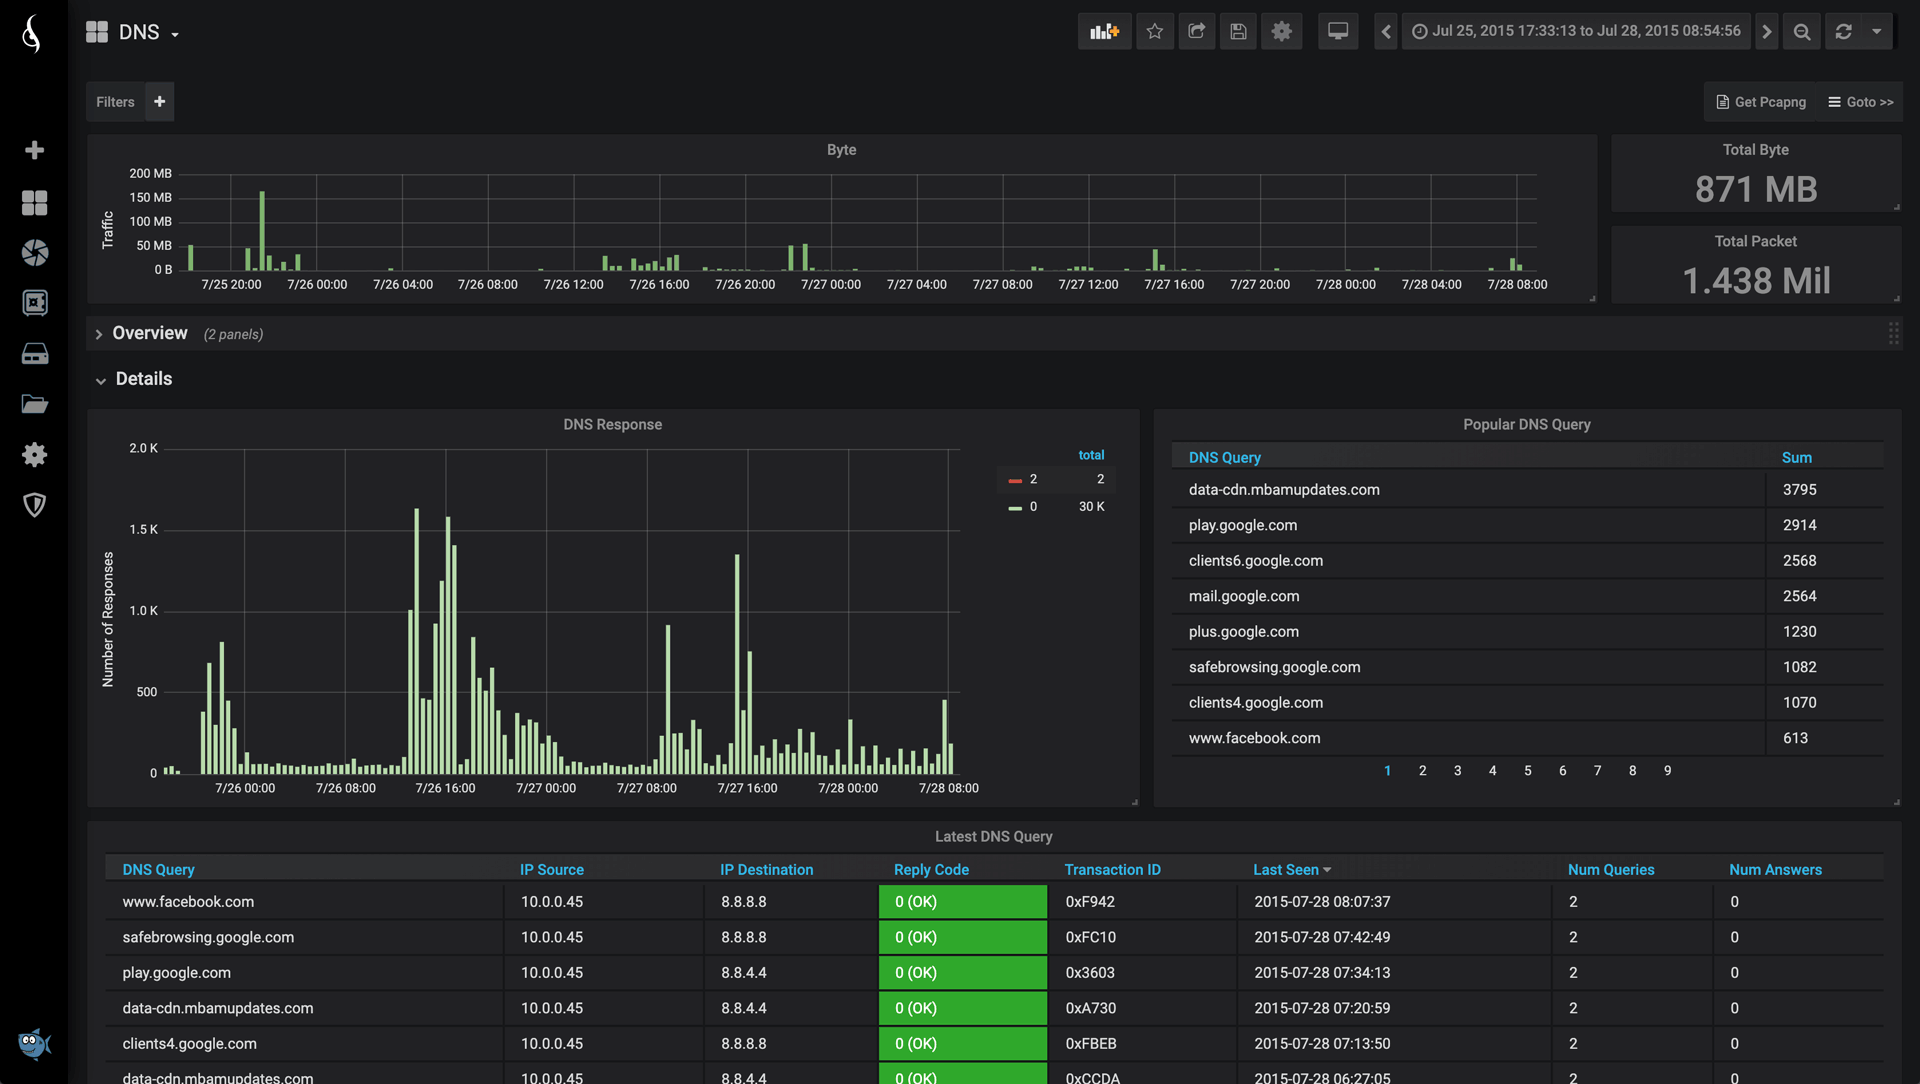
DNS Overview(Click to enlarge)
Overview of top DNS servers and most queried servers.

DNS Details(Click to enlarge)
Overview of top DNS servers and most queried servers.
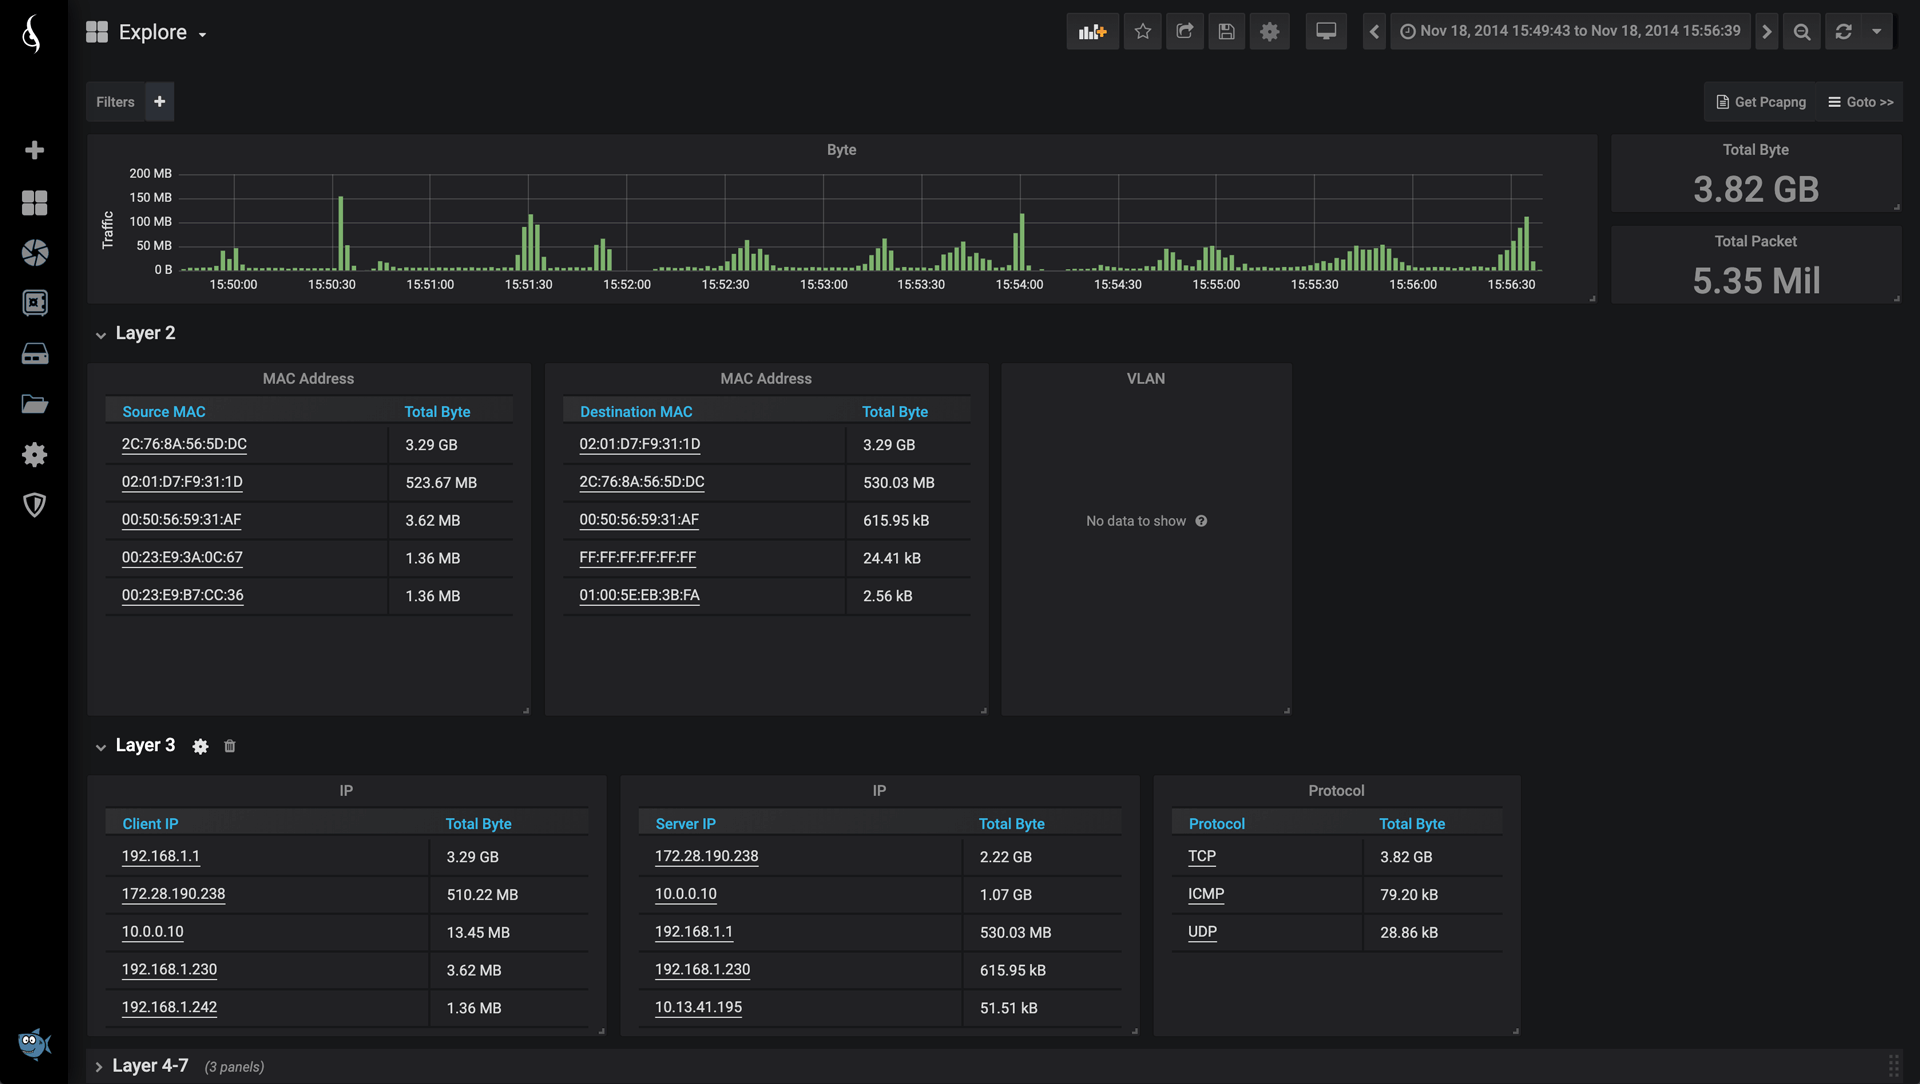
Explore L2L3(Click to enlarge)
Overview of network traffic with devision per OSI layer.
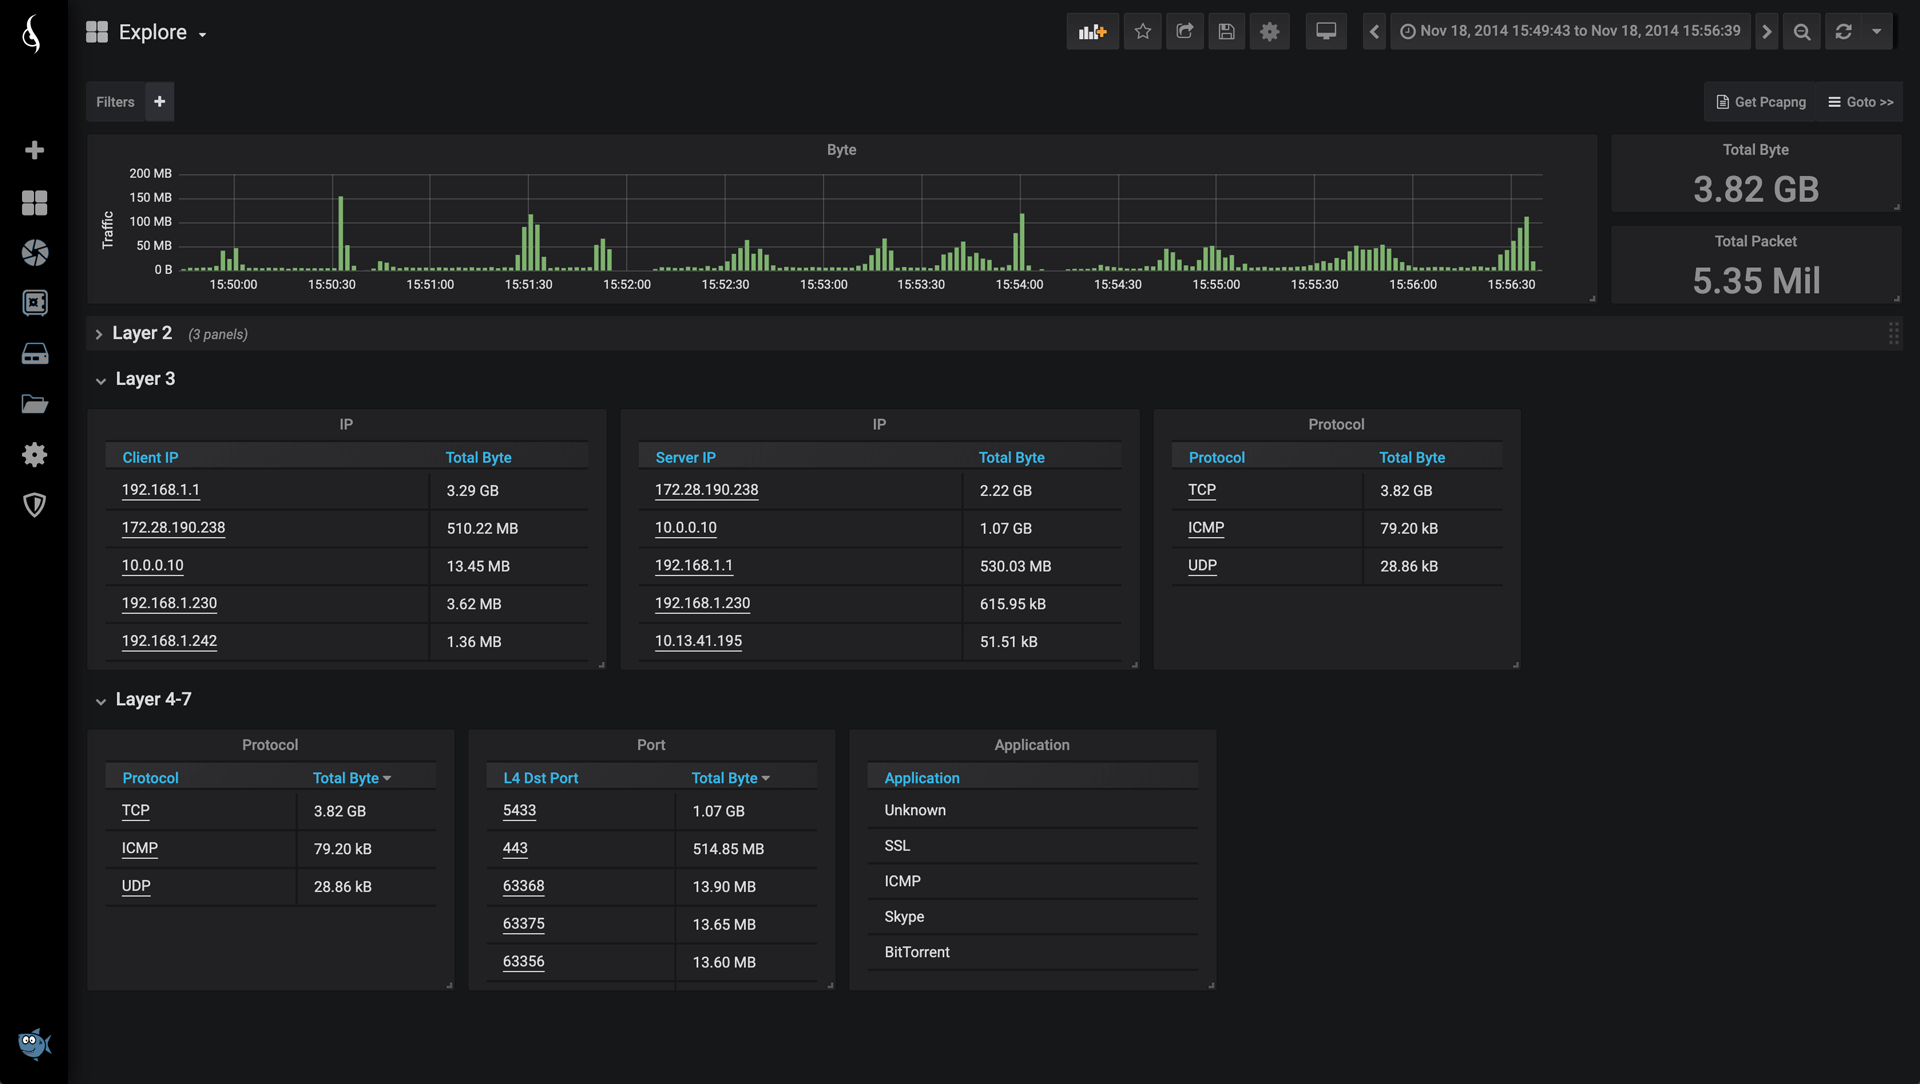
Explore L3L4-7(Click to enlarge)
Overview of network traffic with devision per OSI layer.
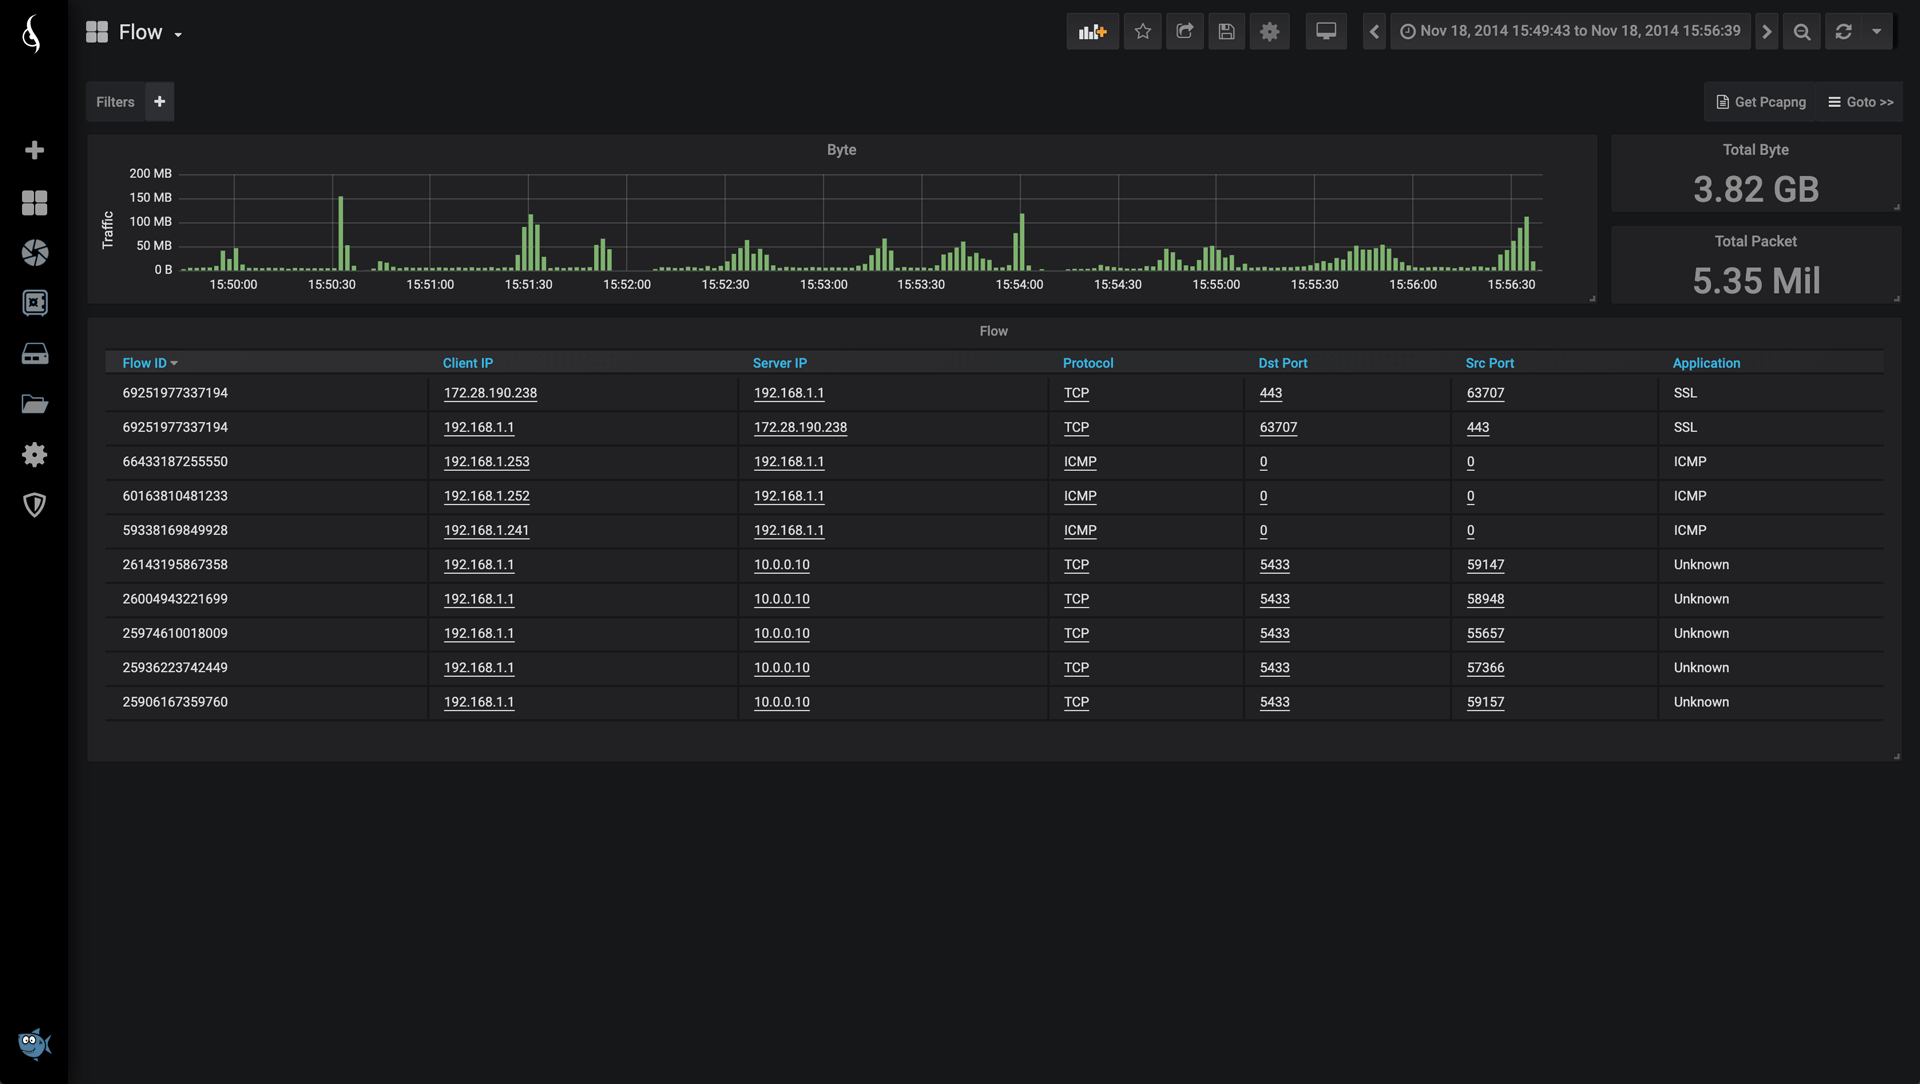
Flow(Click to enlarge)
Analyze application and network traffic based on Flow ID, Client IP, Server IP, Protocol, etc...
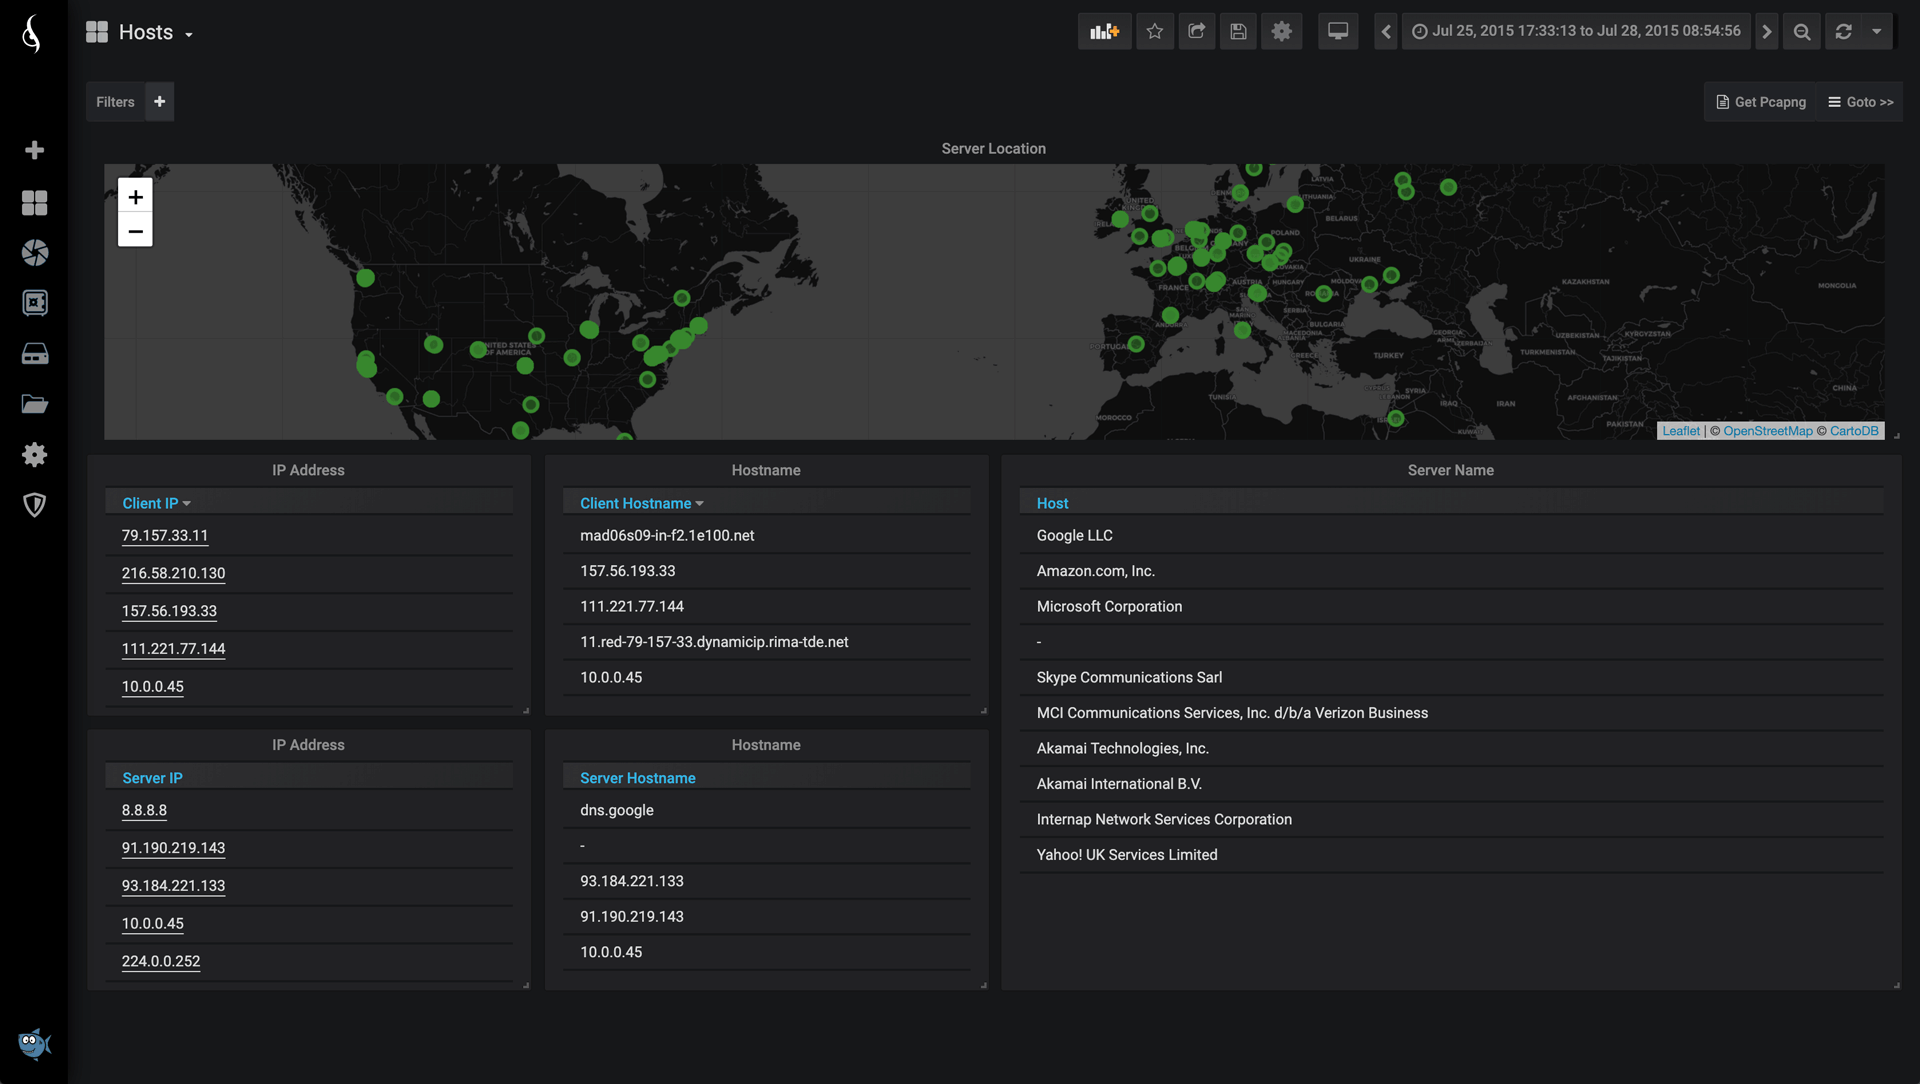
Hosts(Click to enlarge)
Overview of servers, including GeoIP resolution in map.
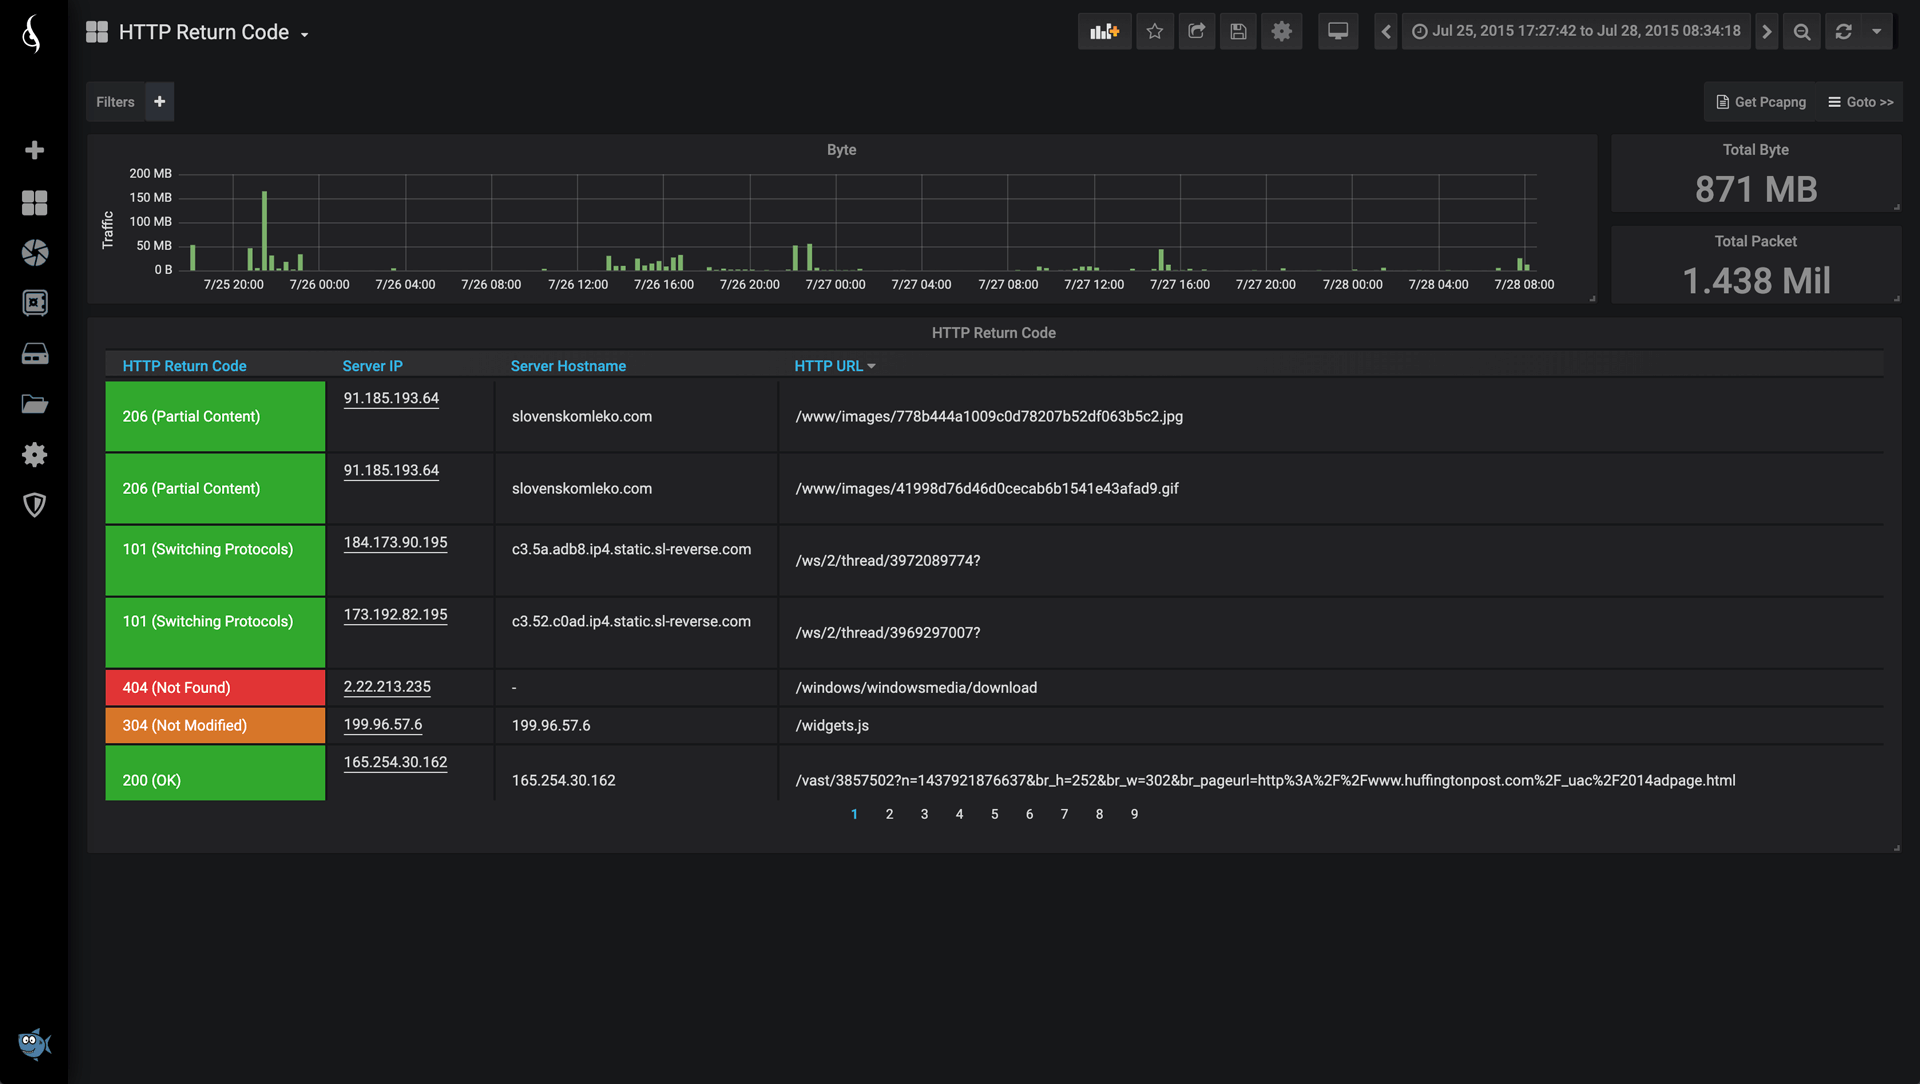
Return Code(Click to enlarge)
Troubleshoot HTTP server response.
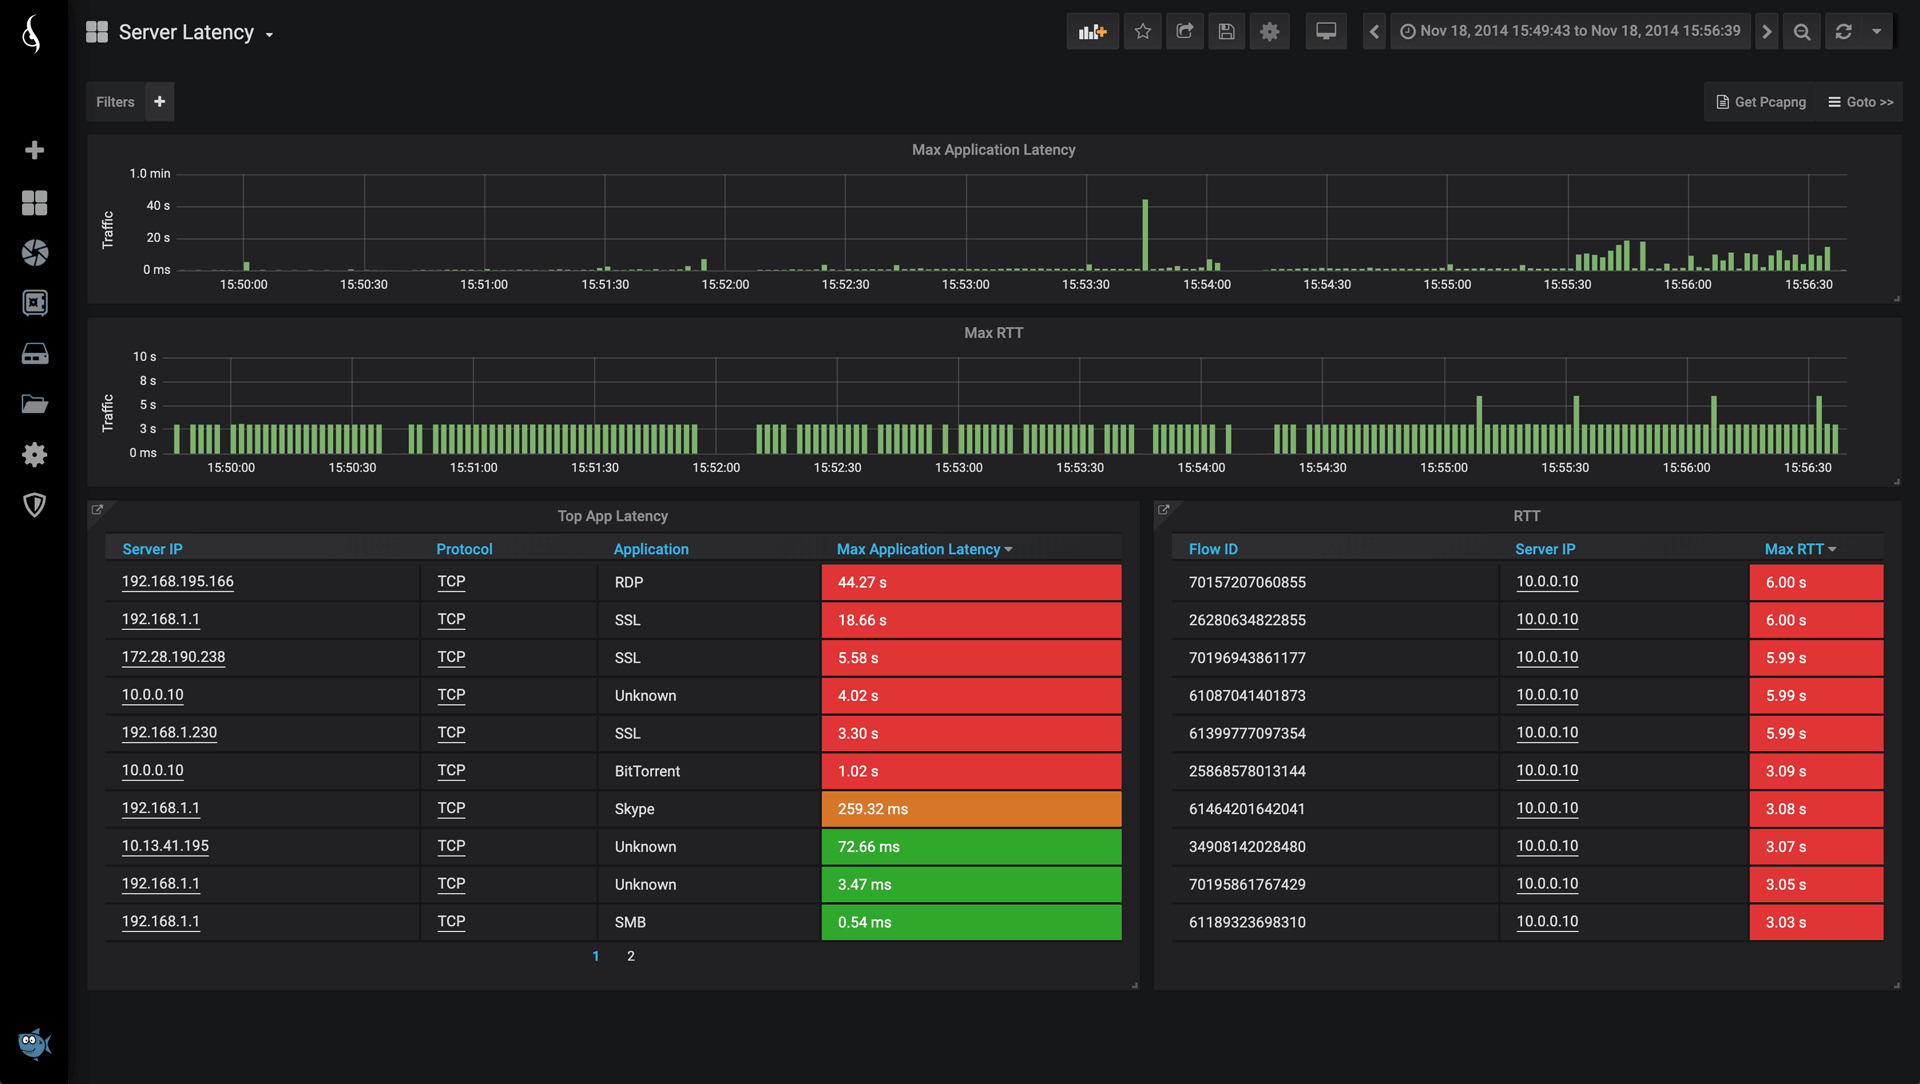
Server Latency(Click to enlarge)
Top application and network latency, including Round Trip Time.
-
CONNECTORS
- 2 x 100M/1G RJ45 capture
- 2 x 1/10G RJ45 capture
- 2 x 10G SFP+ capture
- 2 x RJ45 management
- 1 x RJ45 IPMI
- 2 x USB 3.0
- 1 x 12 VDC power
DIMENSIONS(WxDxH)- 265 x 226 x 43 mm
- 10.43 x 8.9 x 1.69 in
STORAGE- 4, 8, or 16 TB SSD
COMPLIANCE- RoHS, CE, FCC, UKCA, EAC
LEDS & BUTTONS- 16 x link/activity LED
- 1 x capture LED
- 2 x management LED
- 1 x disk activity LED
- 1 x power LED
- 1 x power button
- 1 x reset button
WEIGHT- 2100 g
- 4.63 lb
POWER- Input: 12 VDC
- Adapter: 100-240 VAC to 12 VDC, 12.5 A, 150 W
ACCESSORIES- Rackmount kit with power adapter bracket
- 100-240 VAC to 12 VDC, 12.5 A power adapter
-
Model/ Description
CBC-10-4T
IOTA 10 CORE probe, 4TB internal storage, incl. 1 year warranty and maintenance (+ZeroTier services)
CBC-10-8T
IOTA 10 CORE probe, 8TB internal storage, incl. 1 year warranty and maintenance (+ZeroTier services)
CBC-10-16T
IOTA 10 CORE probe, 16TB internal storage, incl. 1 year warranty and maintenance (+ZeroTier services)
CBC-MAIN
IOTA 10 CORE probe, 1 year extended maintenance (software updates & ZeroTier services)
CBC-WAR
IOTA 10 CORE probe, 1 year extended hardware warranty (does not cover SSD)
-
Product Description
IOTA 10 CORE is a high-speed packet capture and analysis solution designed for core networks, large branch offices, and data centers. Beyond its powerful capabilities, its compact form factor and lightweight design make it an ideal, high-value tool for network engineers who require mobility. Combining high-performance capture, a metadata extraction engine, and integrated analytical dashboards, IOTA 10 CORE delivers complete visibility into critical network segments wherever it is deployed. Through real-time and historical traffic analysis of key application flows, IOTA enables engineers to quickly diagnose network bottlenecks and resolve application latency issues with precision and confidence.
Traffic access, capture, and analysis in a single box
IOTA CORE can be deployed independently at central or critical capture points, or integrated with TAPs and Network Packet Brokers (NPBs) to receive pre-aggregated and pre-filtered traffic from key points of interest across the network. With IOTA’s powerful integrated dashboards, network analysts can further refine, filter, and drill down into captured data for deeper visibility
Features 6 packet capture input ports, providing exceptional flexibility for a wide range of capture and analysis scenarios. It supports 100M, 1G, and 10G speeds — 2 × 100M/1G RJ-45, 2 × 1/10G RJ-45, and 2 × 10G SFP+ interfaces. Ports can be logically grouped within capture sessions to correlate and analyze incoming traffic across multiple connections. With high-speed, high-capacity internal storage, the system enables both real-time and historical analysis of captured network data.
KEEP AN EYE ON
YOUR NETWORK
Monitor hosts, top talkers, latency, TCP, UDP, IPv4, IPv6, VLAN, DNS and many more at a glance, using a premade set of comprehensive dashboards.。REMOTE
MONITORING
Fully managed over HTTPS and with built-in VPN, it offers easy deployment and usage in any network topology.HIGHLY EFFICIENT METADATA COLLECTION
Up to 100 KPIs are extracted from packets, TCP/UDP flow and flow behavior. Flow metadata can reduce the volume of data by 90% compared to the original PCAP trace.MONITOR NETWORK PERFORMANCE
Keep a close eye on the most essential performance metrics, retransmissions, packet loss, latency, throughput, availability, connectivity and more.TRACK DOWN SECURITY FLAWS AND PROTOCOL/APPLICATION USAGE
Full visibility over 3000+ applications and protocols (DNS, HTTP, SSH, Office 365, Skype, Whatsapp, Netflix, etc.)4, 8, or 16 TB STORAGE
PCAP collection, metadata database and system are stored on a high-performance SSD.QUICK SEARCH DATABASE
Explore long-term dataset accumulated over days, weeks or months. -
Sample AnalysisIOTA is built for simplicity.
Anyone can deploy and operate it, while experts can perform remote analysis anytime, anywhere.
Home Dashboard(Click to enlarge)
A quick overview of Top Talkers and client-server data transfers.
TCP Round Trip Time(Click to enlarge)
RTT triggers per flow, server, and client.
TCP flag statistics.
User Experience Application Latency(Click to enlarge)
Application latency from the client IP perspective.
TCP Retransmissions(Click to enlarge)
Retransmissions percentage over time per client and server.
TCP flag statistics.
TCP Server Congestion(Click to enlarge)
An overview of zero windowing events per server over time, detecting when a
server is saturated. Includes statistics of number of flows per server.
TCP OOO and Lost Packets(Click to enlarge)
Top Client / Server lost and Out Of Order packets.
DNS Overview(Click to enlarge)
Overview of top DNS servers and most queried servers.
DNS Details(Click to enlarge)
Overview of top DNS servers and most queried servers.
Explore L2L3(Click to enlarge)
Overview of network traffic with devision per OSI layer.
Explore L3L4-7(Click to enlarge)
Overview of network traffic with devision per OSI layer.
Flow(Click to enlarge)
Analyze application and network traffic based on Flow ID, Client IP, Server IP, Protocol, etc...
Hosts(Click to enlarge)
Overview of servers, including GeoIP resolution in map.
Return Code(Click to enlarge)
Troubleshoot HTTP server response.
Server Latency(Click to enlarge)
Top application and network latency, including Round Trip Time.
-
SpecificationsCONNECTORS
- 2 x 100M/1G RJ45 capture
- 2 x 1/10G RJ45 capture
- 2 x 10G SFP+ capture
- 2 x RJ45 management
- 1 x RJ45 IPMI
- 2 x USB 3.0
- 1 x 12 VDC power
DIMENSIONS(WxDxH)- 265 x 226 x 43 mm
- 10.43 x 8.9 x 1.69 in
STORAGE- 4, 8, or 16 TB SSD
COMPLIANCE- RoHS, CE, FCC, UKCA, EAC
LEDS & BUTTONS- 16 x link/activity LED
- 1 x capture LED
- 2 x management LED
- 1 x disk activity LED
- 1 x power LED
- 1 x power button
- 1 x reset button
WEIGHT- 2100 g
- 4.63 lb
POWER- Input: 12 VDC
- Adapter: 100-240 VAC to 12 VDC, 12.5 A, 150 W
ACCESSORIES- Rackmount kit with power adapter bracket
- 100-240 VAC to 12 VDC, 12.5 A power adapter
-
Ordering Info
Model/ Description
CBC-10-4T
IOTA 10 CORE probe, 4TB internal storage, incl. 1 year warranty and maintenance (+ZeroTier services)
CBC-10-8T
IOTA 10 CORE probe, 8TB internal storage, incl. 1 year warranty and maintenance (+ZeroTier services)
CBC-10-16T
IOTA 10 CORE probe, 16TB internal storage, incl. 1 year warranty and maintenance (+ZeroTier services)
CBC-MAIN
IOTA 10 CORE probe, 1 year extended maintenance (software updates & ZeroTier services)
CBC-WAR
IOTA 10 CORE probe, 1 year extended hardware warranty (does not cover SSD)